North Carolina: State Level Out-of-School Suspensions Report

On average, Black students lose 130 more hours of instruction due to suspensions, than White students.
Research shows that missing 20 or more hours of instruction before taking the fourth-grade National Assessment of Educational Progress in reading lowers achievement by a full grade level (Ginsburg, Jordan, & Chang, 2014).
On average, Black students score more than 20 points lower on the fourth-grade National Assessment of Educational Progress in reading, than White students.
We know from the research on chronic absenteeism that the impact of missing school for any reason can undermine learning. Research shows that missing 20 or more hours of instruction before taking the fourth-grade National Assessment of Educational Progress in reading lowers achievement by a full grade level (Ginsburg, Jordan, & Chang, 2014). Test score data sourced from the National Center for Education Statistics.
- (Okonofua & Eberhardt, 2015)
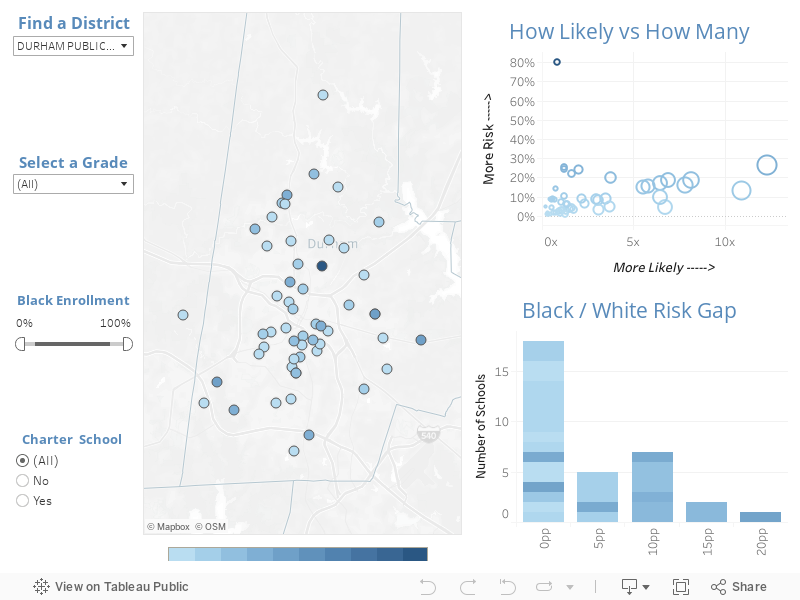
More likely than White students overall
This number represents how likely Black children are to get an out-of-school suspension, when compared to White children.
More likely than White boys
This number represents how likely Black boys are to be given an out-of-school suspension, when compared to White boys.
More likely than White girls
This number represents how likely Black girls are to be given an out-of-school suspension, when compared to White girls.
A risk ratio greater than 1.0 indicates that the risk for Black children is greater than the risk for White children.
Generally, a risk ratio of 1.0 indicates that Black children are no more likely than White children to be issued an out-of-school (OSS) suspension. A risk ratio greater than 1.0 indicates that the risk for Black children is greater than the risk for White children. Accordingly, a risk ratio of 2.0 indicates that Black children are twice as likely as White children to be issued an OSS; a risk ratio of 3.0 indicates that Black children are three times more likely as White children to be issued an OSS; etc. Learn more about Risk Ratios
Help us clean our data.
of Black students overall
This number represents the overall percentage of Black children issued an out-of-school suspension.
of Black boys
This number represents the percentage, or ‘‘rate,’’ of Black boys issued an out-of-school suspension.
of Black girls
This number represents the percentage, or ‘‘rate,’’ of Black girls issued an out-of-school suspension.
By law, schools may not suspend students with disabilities for behavior that is caused by their disability.
The suspension rate is the percentage of Black students issued an out-of-school suspension (OSS) within a particular school, district or state. It is a straightforward calculation that divides the number of students suspended in a student subgroup (e.g., Black students, White students, Black boys with disabilities, etc) by that same subgroup's overall enrollment. For example, if a school serves 100 Black boys and 15 of them were suspended, the ‘”rate” for Black boys to be suspended would be 15 percent (15/100 = 15 percent).
Help us clean our data.
Percentage point gap overall
This number represents the difference between the rate that Black and White children are issued an out-of-school suspension.
Percentage point gap for boys
This number represents the difference between the rate that Black and White boys are issued an out-of-school suspension.
Percentage point gap for girls
This number represents the difference between the rate that Black and White girls are issued an out-of-school suspension.
Large racial disparities in suspension rates can have a dramatic impact on academic and life outcomes for millions of Black families.
The Black-White suspension gap is the difference between the percentage of Black students issued out-of-school suspensions to that of White students. This measure is important because we know that the loss of classroom instruction time damages student performance. With the average suspension at around 3.5 days, large racial/ethnic disparities in suspension rates can have a dramatic impact on academic and life outcomes for millions of Black families.
Help us clean our data.
Power Areas (+)
This section includes links to important resources that can be used to facilitate change in your school or district. We will be updating this area as we find new information that could be useful to parents and community members.