Democratizing Education Data


Measuring Fairness
What is a Risk Ratio?

A risk ratio is the most common method of determining significant disproportionality between ethnic and racial groups. Over 45 different states have used one or more forms of the risk ratio method to help identify large disparities in disciplining and the over identification of Black and Brown students with disabilities.

Riskratio.png


Why use it?

In 2016 the U.S. Department of Education proposed a new rule to improve equity in the Individuals with Disabilities Education Act (IDEA). This rule, for the first time, would require states to implement a standard approach to compare racial and ethnic groups, with reasonable thresholds for determining when disparities have become significant. This determination is critical to reducing the use of potentially inappropriate policies, practices, and procedures as they relate to the identification of children as children with disabilities or gifts, placements in particular educational settings for these children, and the incidence, duration, and type of disciplinary removals.


Comparing Risk

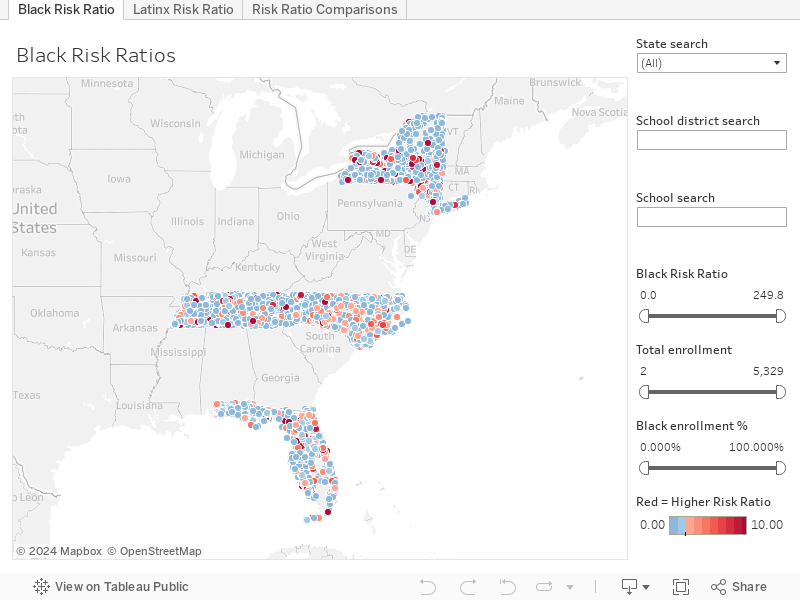
A risk ratio is calculated by dividing the risk of a particular outcome for a child in one racial or ethnic group within a school/district by the risk for children in another racial or ethnic group, within that same school/district.

Generally, a risk ratio of 1.0 indicates that children in a given racial or ethnic group are no more likely than children from another racial or ethnic group to be identified for special education and related services, be identified with a particular impairment, be placed in a particular educational setting, or face disciplinary removals from placement.

A risk ratio greater than 1.0 indicates that the risk for the racial or ethnic group is greater than the risk for the comparison group. Accordingly, a risk ratio of 2.0 indicates that one group is twice as likely as other children to be identified, placed, or disciplined in a particular way; a risk ratio of 3.0 indicates that one group is three times as likely as other children to be identified, placed, or disciplined in a particular way; etc.


IndexDI.png

Risk Ratios and the Discriminology Index

The standard risk ratio sits at the core of the Discriminology equity index. Made up of a curated data set, compiled of multiple risk ratios and other equity measures, our equity index is designed to inform and influence public discourse and policy. Providing a common language for talking about equity in education, that can be understood and accepted by policy makers and educational leaders as well as families and reform advocates.
Learn More >>


Mapping the Risk
Risk Ratio Map for Out-of-School Suspensions
-Best viewed on desktop computer, in full-screen mode-

The out-of-school risk ratio for a given race is calculated by dividing the discipline rate of a specific racial/ethnic group by the rate of White students, with-in a particular school or district. For example, a risk ratio of 1.0x indicates that a Black student is equally as likely to be suspended as White students at her/his school.

All data points in map above are sourced from the 2011/12 school year from the U.S. Department of Education’s Office for Civil Rights (OCR)


Limitations and moving forward

Risk ratios provide little information regarding racial and ethnic disparities when the risk to a racial or ethnic group of interest is zero. While a risk ratio of zero is a fully valid and reasonable result of these calculations, it cannot, in the absence of other information, provide context about the gaps in identification rates across racial or ethnic groups. Further, risk ratios cannot be calculated when the risk to a comparison group is zero, or when there are no children in a comparison group. Due to this we are working with community organizations and schools to help improve data collection efforts across districts and states.

Also, risk ratios alone can be misleading. For example: A risk ratio of 2.0 means one group was twice as likely to be suspended as another. However, a ratio of 2.0 can be found in very low suspending district or a very high suspending one. For this reason, we include risk (i.e., rate) and risk difference in our overall calculations as well.

Over the coming months, we will be releasing several significant updates which include new risk ratio maps covering expulsions, referral to law enforcement, gifted talented identification, special education placement and more. We will also be releasing state level equity analysis for FL, NC, TN and NY. We are actively working with families and local organizations in these communities to enhance data accountability and transparency. Sign up below to get updates on new map and equity report release dates.